70–80% of Powerball and Mega Millions tickets are random. Quick pick vs choose your own numbers: same probability, different sharing patterns.
Between 70% and 80% of the Powerball and Mega Millions tickets sold in the United States are random lines, known as "Quick Pick". The other players choose their numbers by hand. In the quick pick vs choose your own numbers debate, both methods give exactly the same probability of winning. They do not give the same risk of sharing a prize.
70–80% of tickets: Quick Pick dominates
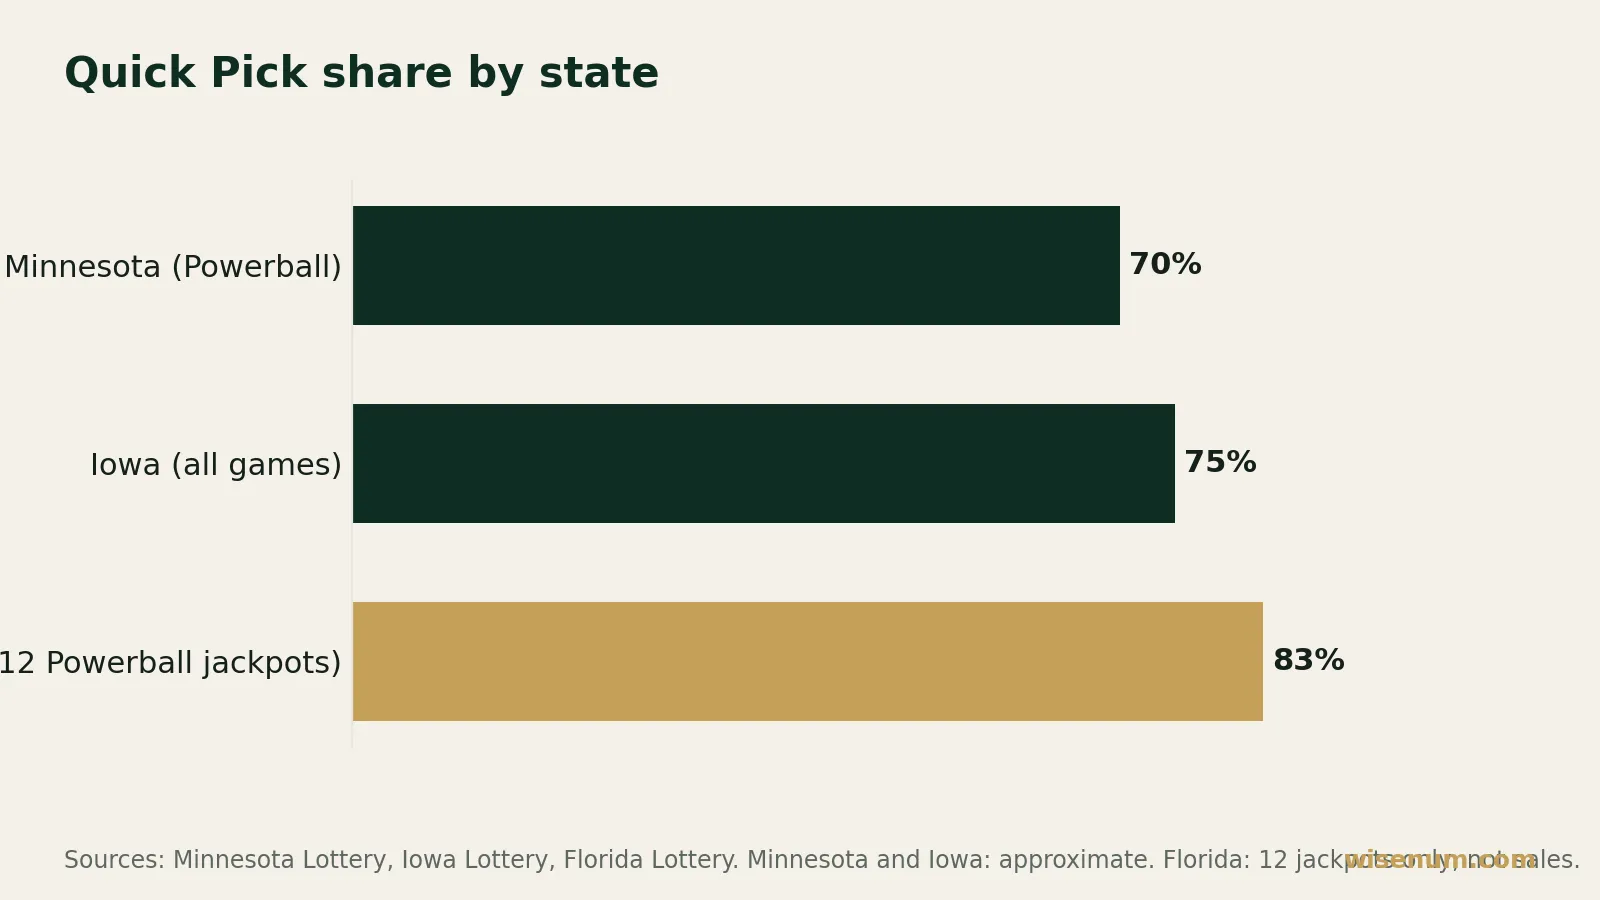
A Quick Pick is a line drawn at random by the sales terminal. According to the figures gathered for this article, it accounts for 70–80% of the Powerball and Mega Millions tickets sold in the United States (Multi-State Lottery Association). The share varies by state:
- Minnesota: about 70% of Powerball tickets (Minnesota Lottery).
- Iowa: about 75%, across all games (Iowa Lottery).
- Florida: 83% of random lines among the 12 Powerball jackpots won since 2009 (Florida Lottery).
The math is simple. If 70–80% of tickets are random, then only 20–30% are picked by hand.
Florida has 12 jackpots. That number is too small to draw a rule from: it describes what happened, it explains nothing.
Same probability, whether you choose or not
Every combination has the same probability of being drawn, however it was produced (LegalClarity, NBC Connecticut). For the jackpot:
- Powerball: 1 in 292,201,338.
- Mega Millions: 1 in 290,472,336, since April 8, 2025 (12,103,014 white-ball combinations × 24 Mega Ball numbers). The details of the change are in our article on the new Mega Millions rules.
- EuroMillions: 1 in 139,838,160.
The draw does not know how your line was filled in. The combination 1-2-3-4-5 has the same probability as a combination from a Quick Pick. A random line is therefore no better than a chosen line, and a chosen line is no better than a random one.
Where it differs: sharing and birthday dates
The difference plays out after the draw, when several winners share the same jackpot. Players who choose their own numbers often draw on dates: a birthday, a wedding date. A day of the month runs from 1 to 31.
In Powerball, the white balls run from 1 to 69. The numbers 1 to 31 therefore cover 31 ÷ 69, or about 45% of the range. If lines were spread evenly, the share of lines whose five white numbers all fall between 1 and 31 would be:
- Five-number lines out of 31: 169,911.
- Five-number lines out of 69: 11,238,513.
- Share: 169,911 ÷ 11,238,513, or about 1.5%.
A randomly drawn line falls in this zone about one time in 66 (11,238,513 ÷ 169,911 ≈ 66). A line built only from dates falls there every time, by construction. When such a combination is drawn, it was probably played by more people, according to the Wisenum estimate presented below, and the jackpot may be split into more shares.
A Quick Pick does not follow this habit. It spreads its numbers across the whole range, so it is less exposed to this clustering. That does not change its probability of being drawn. It only reduces the risk of having to share the prize if it is drawn. To go further on this habit, read why players choose the same numbers.
Wisenum data: measuring how lines cluster
Wisenum estimates how popular the played lines are from the official winner counts for each draw. A ratio above 1 indicates that players do not pick their numbers at random: some combinations are played more often than others. This estimate covers all players, Quick Pick included: it does not separate the two methods.
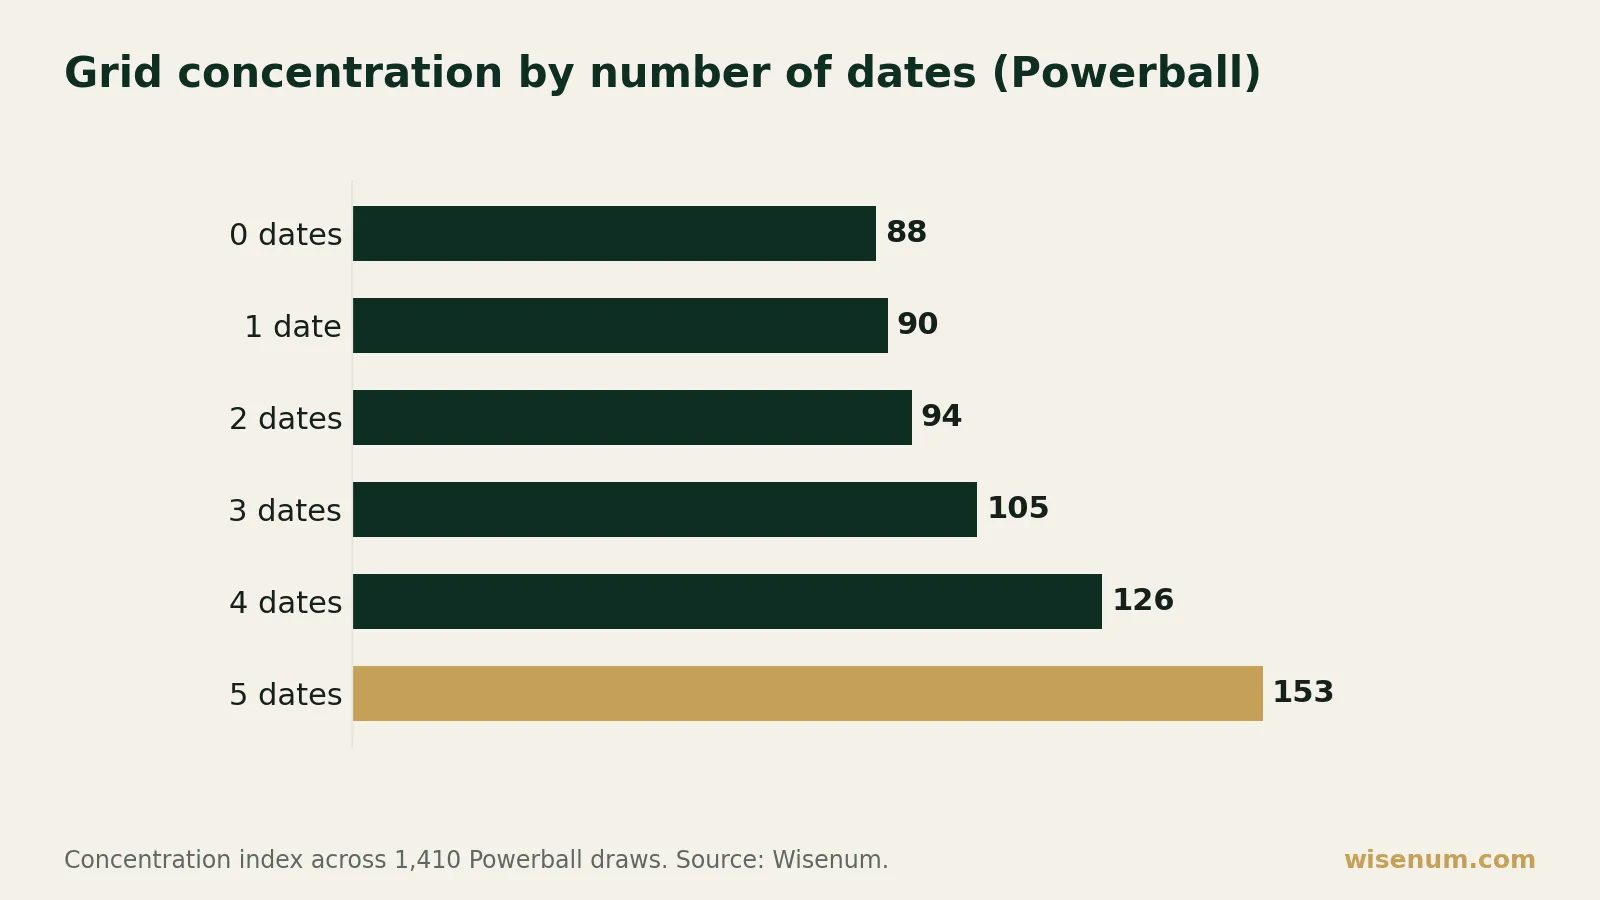
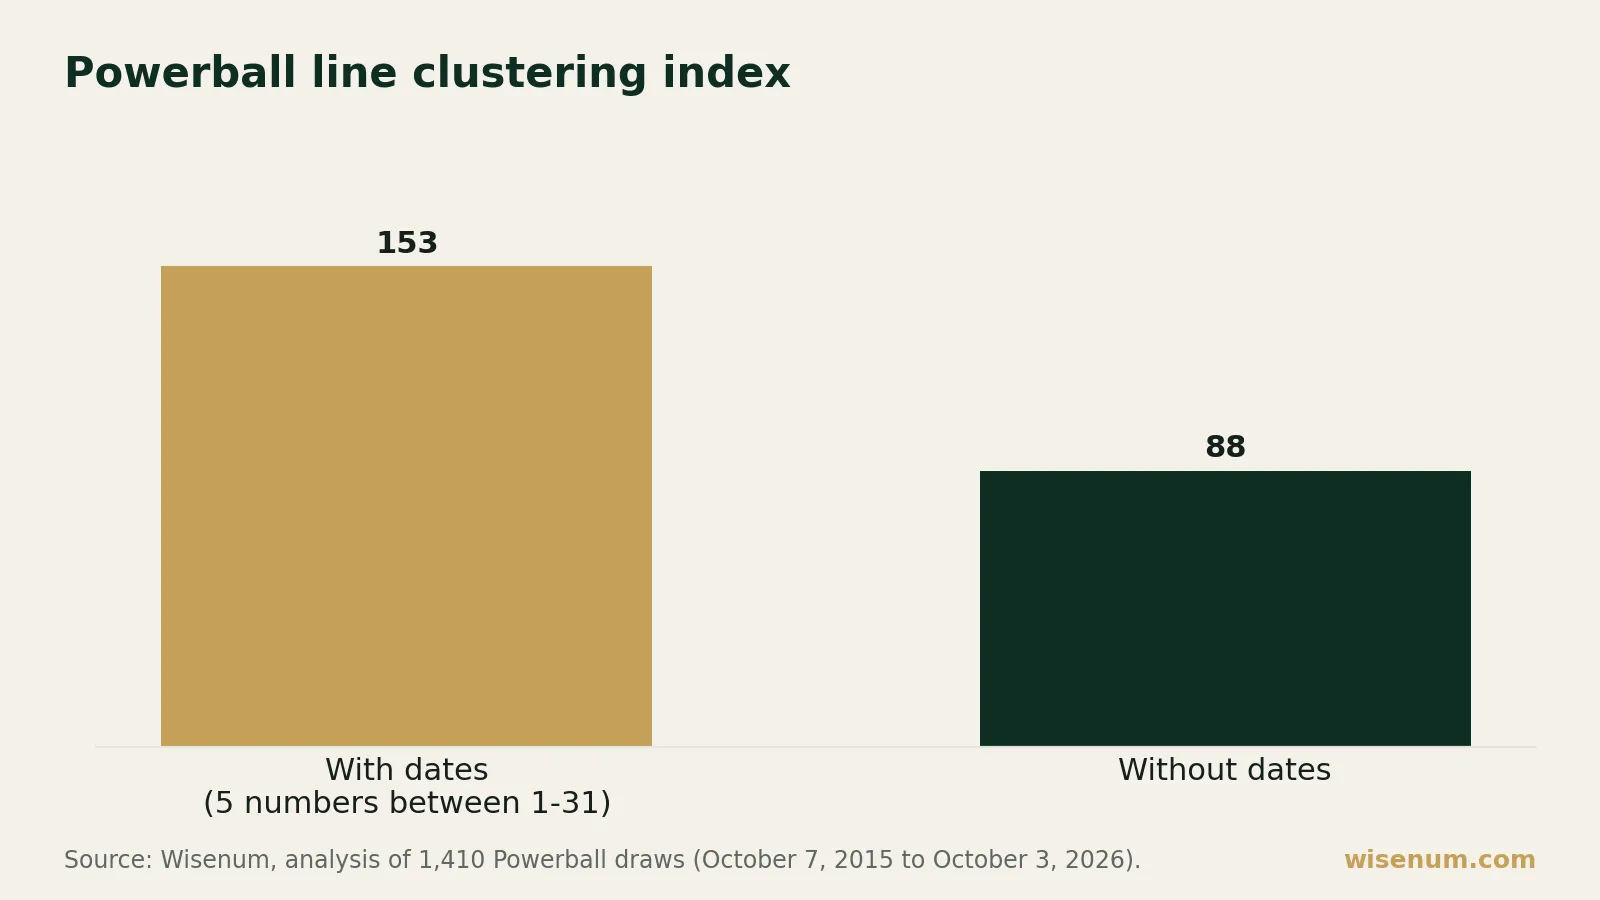
- Powerball, dates: over 1,410 draws (October 7, 2015 to October 3, 2026), draws whose five main numbers could all be dates (all between 1 and 31) have a popularity index of 153, versus 88 for draws with none. The ratio is 1.732 (95% confidence interval: 1.639 to 1.829). The sample sizes are unequal: 22 draws for all five numbers, 58 for none.
- Powerball, all draws: the popularity ratio is 1.264 over the last 200 draws, since June 25, 2025 (interval: 1.216 to 1.314).
- EuroMillions: the ratio is 1.128 over the last 200 draws, since November 5, 2024 (interval: 1.108 to 1.149).
A 95% confidence interval gives the range in which the true value most likely lies. Here, every interval stays above 1. For all draws, the Powerball ratio is higher than the EuroMillions ratio: the two intervals do not overlap.
Two limits. For Powerball, the estimate covers the five main numbers, not the Powerball number. And the model relies on winner counts in the lower prize tiers: the number of lines actually sold is not published. This is an estimate, not a count.
These ratios describe how lines cluster, so they describe sharing, not the probability of winning. Choosing your numbers makes you neither more nor less likely to win. To reduce the risk of sharing, other approaches exist to limit jackpot sharing.
The takeaway
A Quick Pick and chosen numbers have the same probability of being drawn: 1 in 292,201,338 for Powerball, 1 in 290,472,336 for Mega Millions, 1 in 139,838,160 for EuroMillions. The difference lies in sharing: lines built on dates fall in a zone where lines look more alike, and Wisenum data measure stronger clustering there in Powerball. No method gives an edge over the draw, but a line far from the most frequent picks reduces the risk of sharing a prize.
Playing Powerball? See where your line sits among other players' picks: Analyze a line
Play for fun, and only spend what you can afford to lose. Responsible gambling support: in the US, call 1-800-GAMBLER (ncpgambling.org); in the UK, visit BeGambleAware.
Frequently asked questions
Does a Quick Pick have a higher probability of winning than chosen numbers?
No. Every combination has exactly the same probability of being drawn, whether your line is random or chosen. The difference comes after the draw, in the risk of sharing the prize with other winners.
What share of tickets are Quick Pick?
Between 70% and 80% of the Powerball and Mega Millions tickets sold in the United States, according to the figures gathered for this article. The share varies by state: about 70% in Minnesota for Powerball, about 75% in Iowa across all games.
How does choosing between Quick Pick and your own numbers affect jackpot sharing?
Players who choose their own numbers often draw on dates (1 to 31), which makes their lines more similar to one another. A Quick Pick spreads its numbers across the whole range: it is less exposed to this clustering, and so to the risk of sharing the prize. Its probability of being drawn does not change.
What do Wisenum data show about dates?
In Powerball, draws whose five main numbers could all be dates (1 to 31) have a popularity index of 153, versus 88 for draws with none, a ratio of 1.732. This is an estimate of how popular the played lines are, not a count of lines sold, and it does not separate Quick Pick from chosen numbers.
Every valid combination has the same probability of being drawn. Wisenum does not predict winning numbers.
Sources
- Multi-State Lottery Association (MUSL) — Powerball Quick Pick Statistics
- LegalClarity: Lottery Quick Pick — Random Number Selection in Draw Games
- Minnesota Lottery — In The Know With Pick 3
- NBC Connecticut — Powerball Jackpot Winning Odds: Quick Pick vs. Choosing Numbers
- Wisenum Data — Birthday Numbers Clustering Effect on Powerball and EuroMillions
- Iowa Lottery — Quick Pick Usage Statistics
- Florida Lottery — Winning Number Analysis
- Davidson College Research — How to Tilt the Odds of Winning: Birthday Numbers and Prize Sharing
- Image : File:Filling lottery ticket 20180215.jpg (CC BY-SA 4.0, Wikimedia Commons)