Lottery number patterns: dates, lucky numbers and shapes on the slip. Wisenum data on how popular lines change the risk of sharing a win.
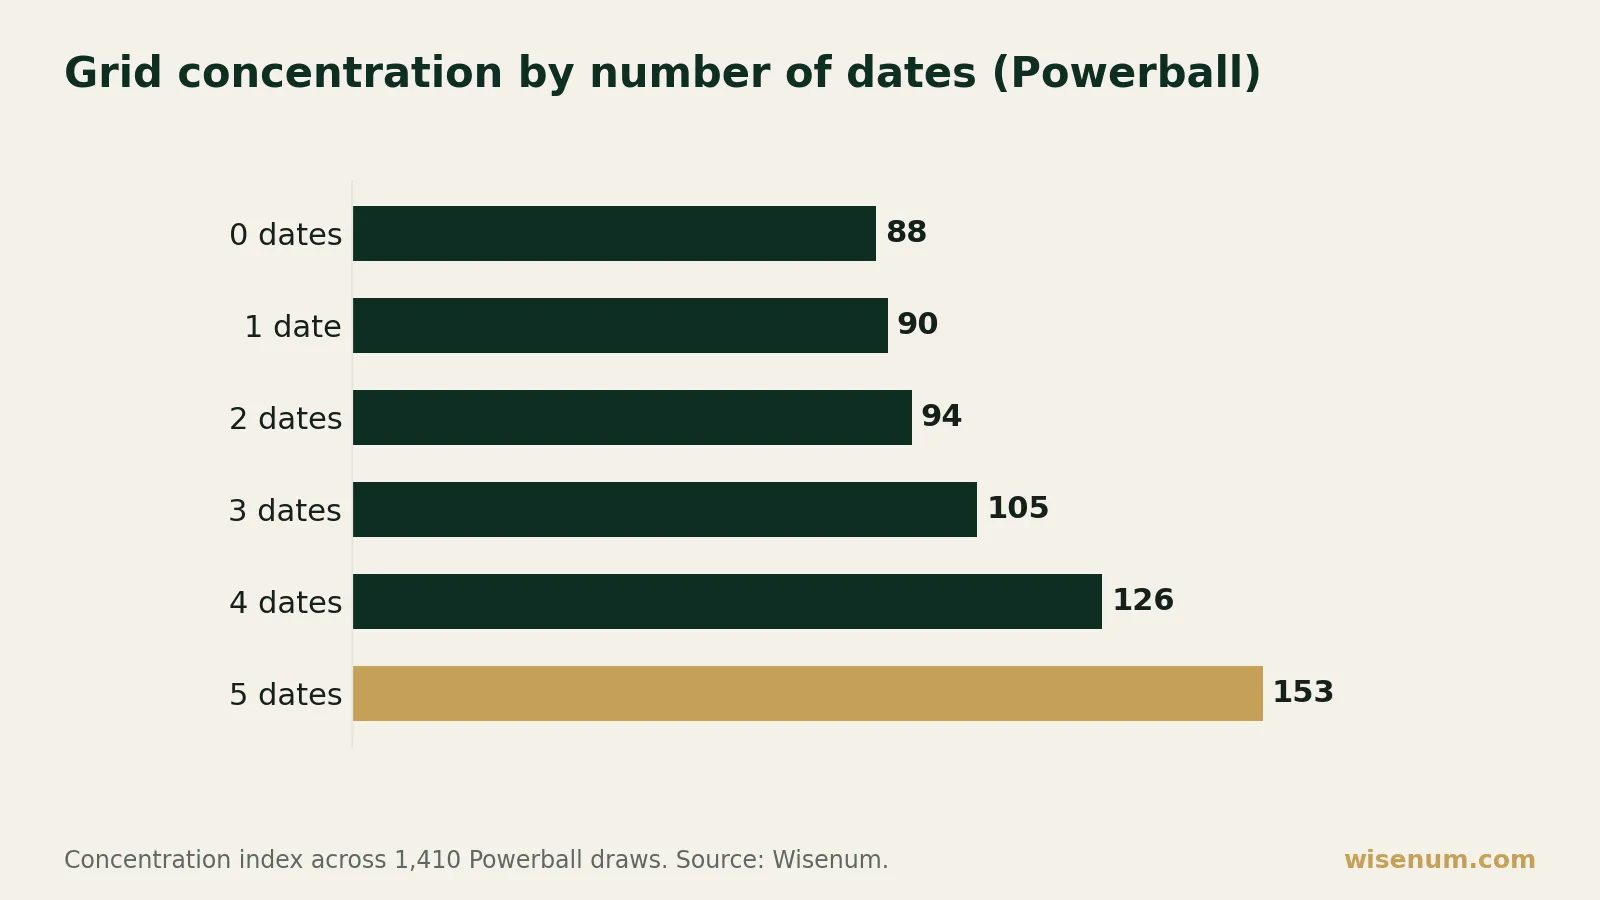
Lottery number patterns are measurable. In Powerball draws where all five main numbers could be dates, the popularity index is 153, against 88 for draws containing none. Players do not choose at random, while the draw itself is random. This gap does not change the probability that a line comes up, but it does change how many people you would share a win with.
How players choose their numbers
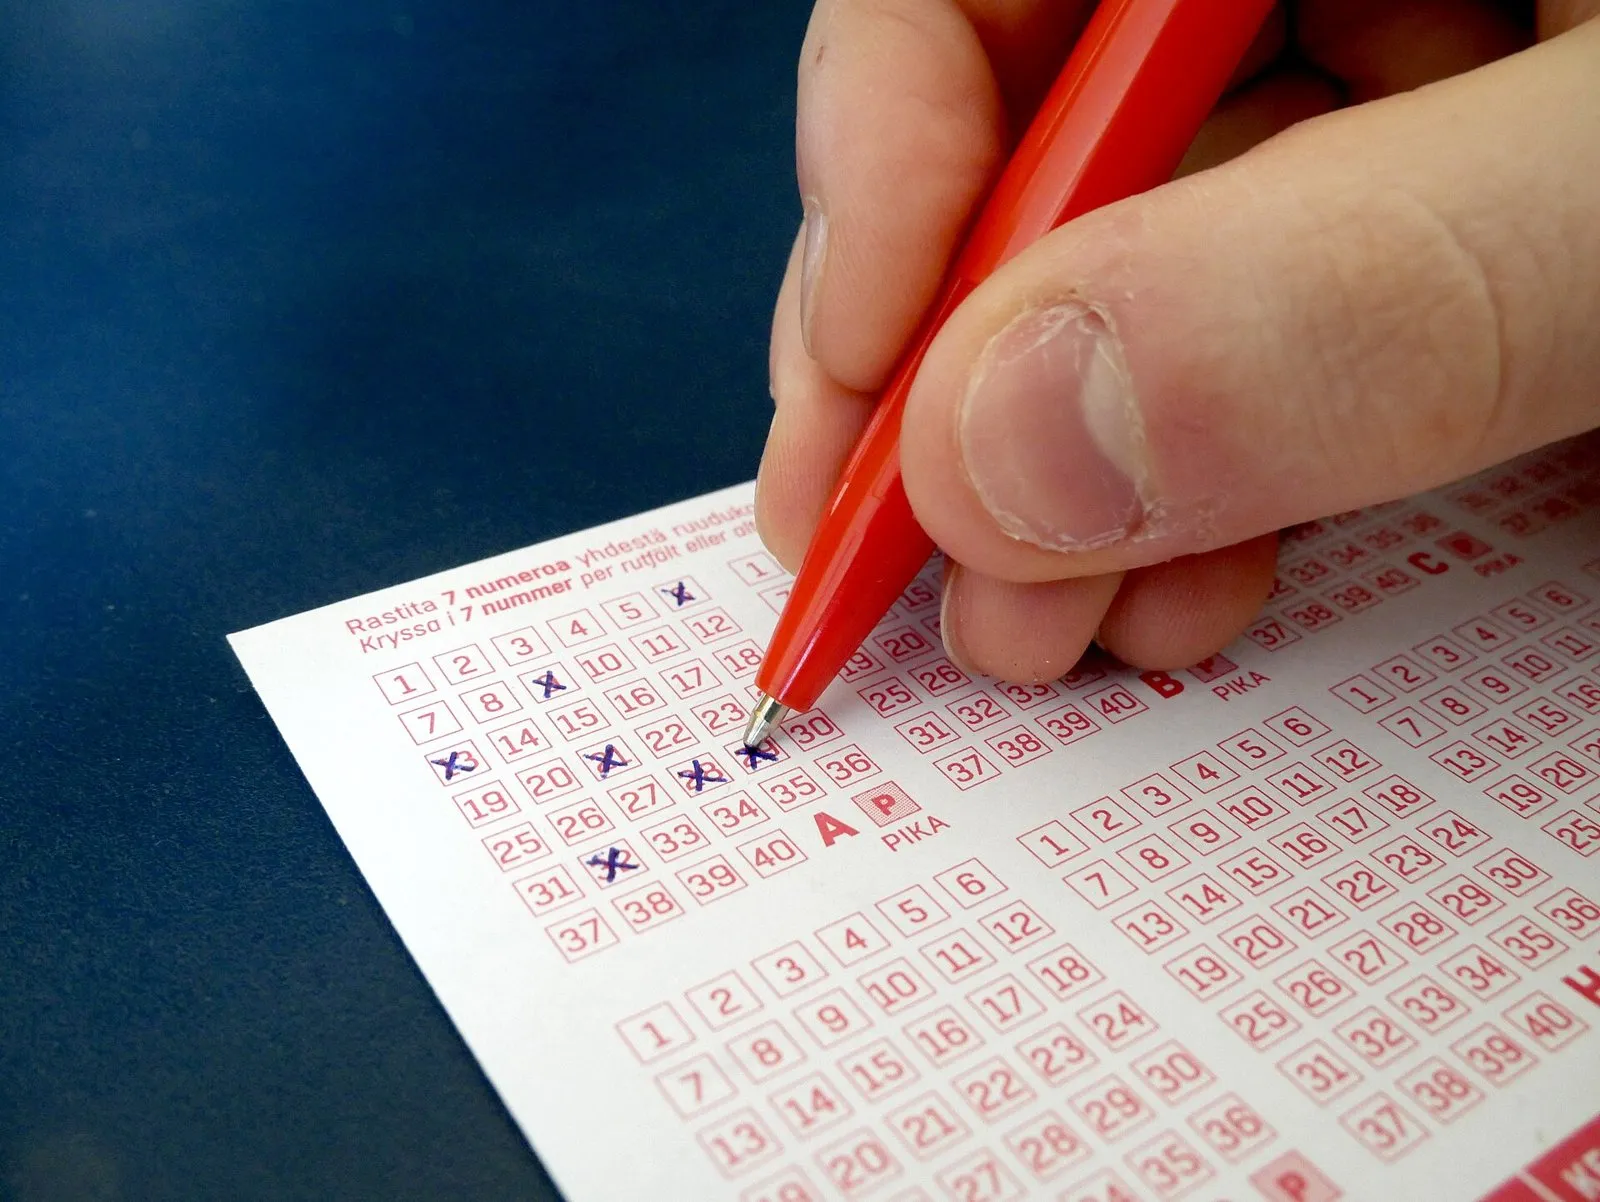
Several published studies show that hand-filled lines follow recognizable habits.
- Personal dates. In a study of 5.1 million combinations, the day of birth is chosen on average 7 percentage points more often than by chance (p < 0.001). Birth month and year, age and postal codes are also among the reference points used (Wang et al., Judgment and Decision Making).
- Dates of the moment. Players also draw on today's date, the draw date, and even the advertised jackpot amount (same study).
- "Lucky" numbers. In the Israeli lottery, 800 million selections spread over 118 draws were analyzed. The number 7 was the most chosen in every draw (100% of cases) and 37 the least chosen (100% of cases). With 37 numbers and a random choice, each would have been picked 1 time in 37, or 2.7% of the time (Bar-Hillel et al.).
- Shapes on the slip. Players like combinations that form a symmetrical or regular pattern, and spread their numbers fairly evenly. Numbers at the top of the slip are more popular than those at the bottom (same studies).
One important caveat: these sources establish a taste for dates, lucky numbers and patterns on the grid. They do not quantify, separately, how often sequences or diagonals are played. We therefore give no percentage for them.
The "birthday" effect is still current. A 2024 Belgian study finds it among Lotto players, more marked in women than in men, and links it to a deliberate rather than automatic choice (D'Hondt et al., Journal of Gambling Studies). For the details of this effect, see how birthday dates influence lottery choices.
Why this concentrates the lines
If thousands of players start from the same pool of numbers (those on a calendar, a favorite digit, a shape that pleases the eye), their lines look alike. Some combinations are then played by many people, others by very few.
Wisenum measures this effect with a "popularity ratio", built from official winner counts:
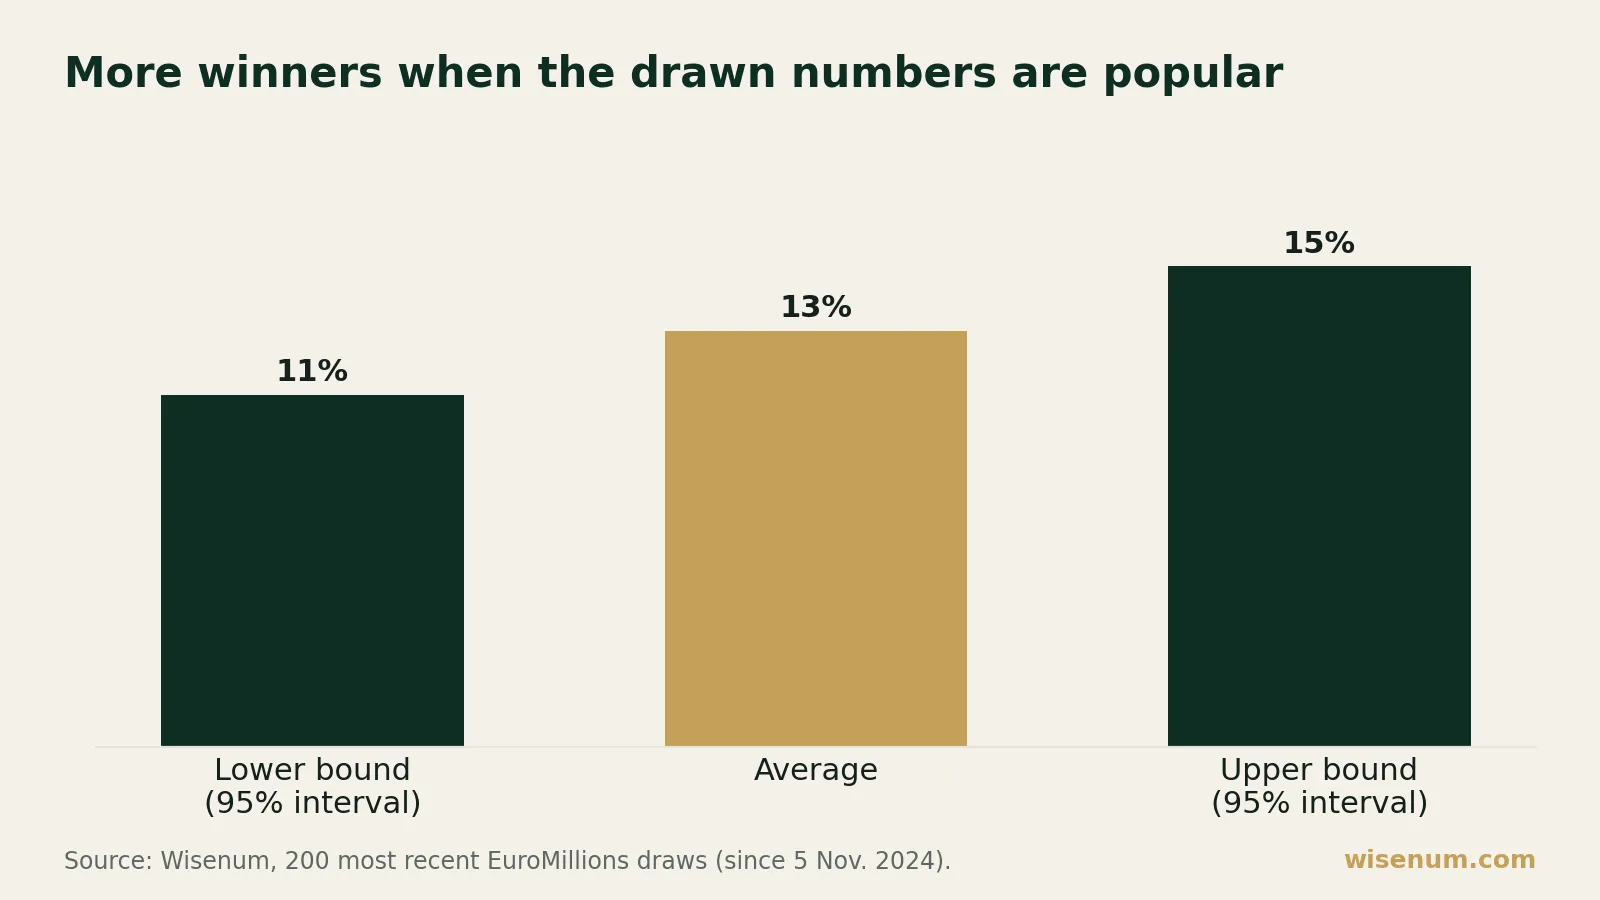
- EuroMillions: 1.128 over the last 200 draws, since November 5, 2024 (95% confidence interval: 1.108 to 1.149).
- Powerball: 1.264 over the last 200 draws, since June 25, 2025 (95% confidence interval: 1.216 to 1.314).
The two intervals do not overlap: the ratio measured for Powerball is higher than the one for EuroMillions. These ratios come from Wisenum models, validated on official data (for EuroMillions, 694 draws between February 4, 2020 and September 25, 2026).
What Wisenum data shows about dates
For Powerball, Wisenum ranked 1,410 draws (from October 7, 2015 to October 3, 2026) by the number of main numbers that could be birthday numbers. The more there are, the higher the index climbs:
- 0 birthday numbers: index 88 (58 draws)
- 1 number: index 90 (287 draws)
- 2 numbers: index 94 (541 draws)
- 3 numbers: index 105 (361 draws)
- 4 numbers: index 126 (141 draws)
- 5 numbers: index 153 (22 draws)
The ratio between "five birthday numbers" and "none" is 1.732 (95% confidence interval: 1.639 to 1.829). Put simply: draws with five "calendar" numbers are associated with clearly more heavily played lines than those with none.
Two limits to keep in mind. First, these estimates cover the main numbers, not the Powerball number. Second, the model relies on winner counts in the lower prize tiers: actual participation (the number of lines sold) is not published. This is an estimate, not a count.
Probability and sharing: two separate things
The probability of a combination can be calculated, and it does not depend on its popularity.
- EuroMillions (5 numbers out of 50, 2 Lucky Stars out of 12): 2,118,760 × 66 = 139,838,160 combinations. Each line therefore has a 1 in 139,838,160 chance. For a concrete picture: 139,838,160 ÷ 31,557,600 seconds per year (365.25 × 86,400) ≈ 4.4, like picking one specific second out of about 4.4 years of seconds.
- Powerball (5 numbers out of 69, 1 Powerball out of 26): 11,238,513 × 26 = 292,201,338 combinations, or 1 in 292,201,338 per line.
A line made of dates and the line 1-2-3-4-5 with Lucky Stars 1 and 2 have exactly the same probability in EuroMillions, 1 in 139,838,160. The draw does not look at what players have chosen.
What changes is what happens afterwards. Jackpots are shared among winners of the same tier. If a very popular line comes up and three people had played it, the jackpot is split three ways: each receives a third (a purely arithmetic example, with no amount). If a rare line comes up and only one person had played it, they keep everything. The expected value, that is the average amount won, therefore varies with the popularity of the line. The probability of being drawn does not.
To go further on orders of magnitude, see understanding Powerball numbers and where the EuroMillions jackpot odds come from.
The takeaway
Players do not choose at random: birth dates, favorite numbers and shapes on the slip concentrate the lines. This effect is measurable, with a popularity ratio of 1.128 in EuroMillions and 1.264 in Powerball according to Wisenum models. But all combinations have the same probability of coming up. What other people's choices change is the number of winners a prize would be shared with.
See where your own line stands among the most common picks: Analyze a line
Play for fun, and only spend what you can afford to lose. Responsible gambling support: in the US, call 1-800-GAMBLER (ncpgambling.org); in the UK, visit BeGambleAware.
Frequently asked questions
Why do players so often choose the same numbers?
Players rely on shared reference points: birth dates, lucky numbers and visual patterns on the slip. Studies show the day of birth is chosen 7 percentage points more often than by chance. This effect can be measured with the Wisenum popularity ratio.
How do players' choices affect the probability of winning?
They do not. All combinations have the same probability of coming up, whether or not they contain dates. What changes is the number of people you would share a win with if your line came up.
How does Wisenum measure the popularity of lines?
With a popularity ratio, built from official winner counts. In EuroMillions it is 1.128 over the last 200 draws. In Powerball it is 1.264, which is higher.
Are draws made of date numbers associated with more identical lines?
In Powerball, the index for draws whose five main numbers could all be dates is 153, against 88 for draws containing none. The ratio is 1.732: these draws are associated with more heavily played lines. This is an estimate based on winner counts, not a count of lines sold.
Does avoiding popular numbers change the probability of coming up?
No. In EuroMillions, a line made of dates and a rare line each have a 1 in 139,838,160 chance of coming up. Only the number of people a win would be shared with depends on how popular the line is.
Every valid combination has the same probability of being drawn. Wisenum does not predict winning numbers.
Sources
- Number preferences in lotteries
- Patterns in manually selected numbers in the Israeli lottery
- Is There a Gender Gap in the Birthday-Number Effect? The Case of Lotto Players and the Role of Sequential Choice
- Wisenum data — Probabilistic models and popularity indices (EuroMillions and Powerball)
- Lottery odds explained — Combinations formula and official probabilities
- Image : File:Filling lottery ticket 20180215.jpg (CC BY-SA 4.0, Wikimedia Commons)