How ticket sales drive the risk of splitting a big jackpot, explained with official figures and a simple Poisson calculation.
On January 13, 2016, the $1.586 billion Powerball jackpot didn't have one winner but three: one ticket sold in California, one in Florida and one in Tennessee. The bigger a jackpot grows, the more tickets are sold, and the higher the probability of sharing the top prize. Here is the relationship behind large jackpot shared winners probability, with the data and the calculation.
One point up front: none of this changes the probability of winning, which is the same for every line. It only describes what happens if a line wins: you collect the jackpot alone, or with others.
The bigger the jackpot, the more tickets are sold
Data from US operators show a clear link between the advertised amount and sales. According to historical Powerball sales published by lottoreport.com from Multi-State Lottery Association data, weekly sales are roughly 2 to 3 times higher around a $600 million jackpot than at the minimum jackpot of $20 million.
Academic work points the same way:
- for Powerball from 2015 to 2022, polynomial regression models linking jackpot and sales show an R² of 0.89 to 0.90, which means the jackpot amount explains a large share of the variation in sales (university analyses of Powerball data);
- for EuroMillions between 2004 and 2008, the correlation between jackpot and sales is 0.89 (study comparing nine countries);
- in econometric models covering nine European countries, a smaller jackpot amounts to a higher effective ticket price: each 1% rise in that price reduces sales by 0.6 to 0.9%.
One limit: for EuroMillions, there is no single official source that gathers draw-by-draw sales for the nine participating countries. The models rely on data from 2004 to 2008, which is now dated.
The calculation: how many winners should you expect?
Imagine that every line is chosen at random, independently of the others. The number of winners then follows, approximately, a Poisson distribution: the classic model for counting rare, independent events.
Let's define:
- N: the number of tickets sold for the draw;
- p: the probability that one ticket wins, which is 1 in 292.2 million for Powerball since October 2015;
- m = N × p: the average number of winners expected.
The calculation gives:
- probability of no winner: P(0) = e^(−m);
- probability of exactly one winner: P(1) = m × e^(−m);
- probability of at least two winners: P(≥2) = 1 − (1 + m) × e^(−m).
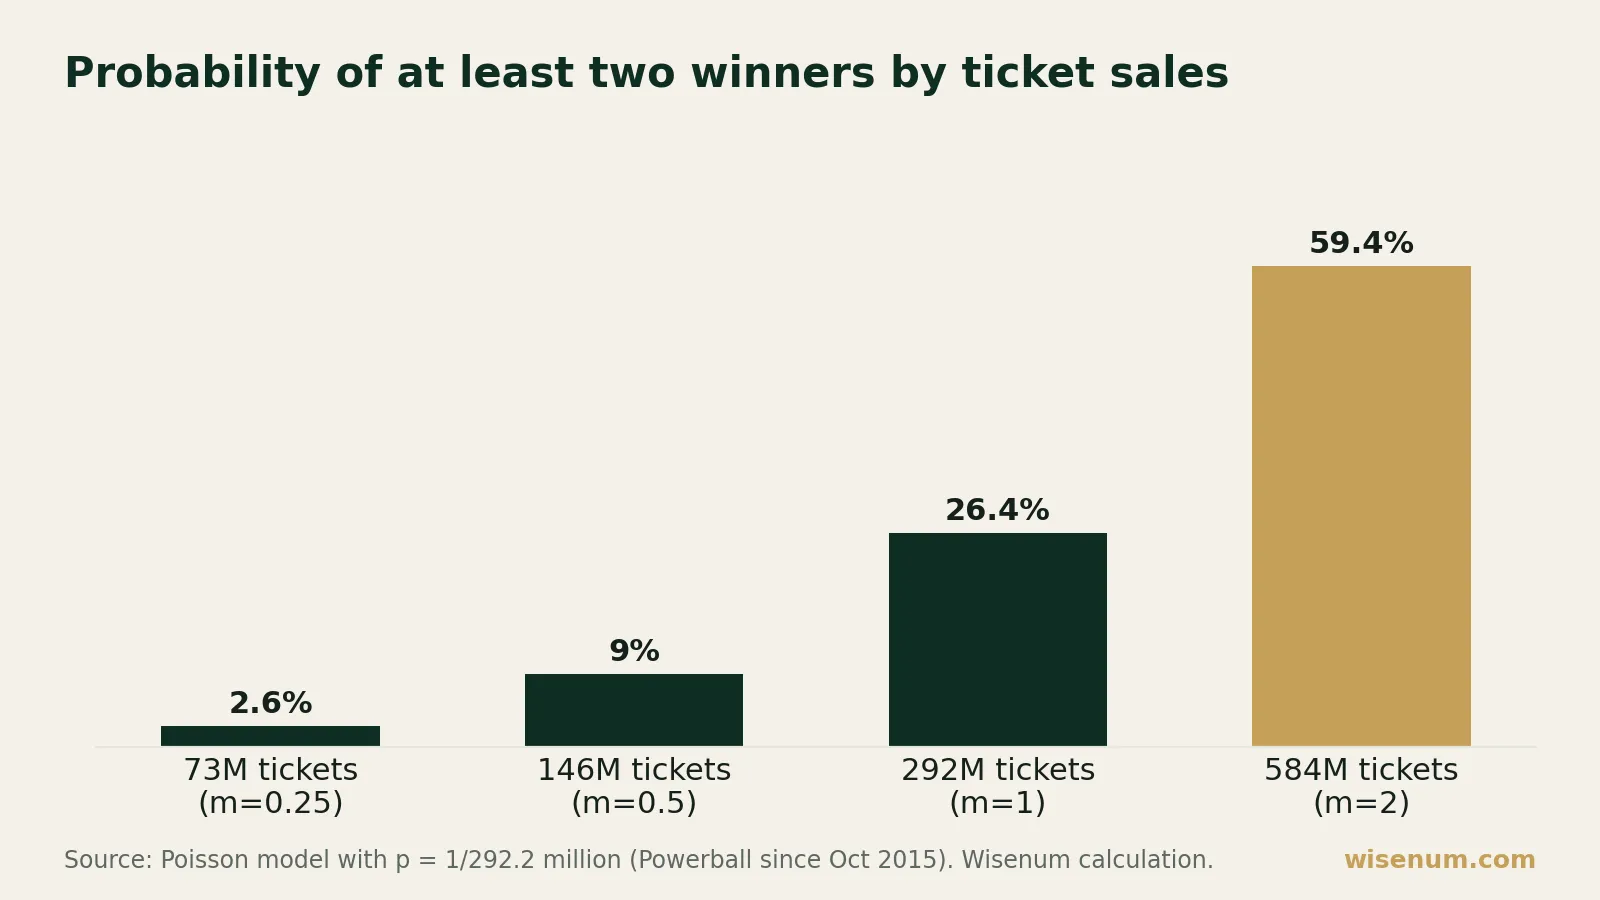
Here is what that gives with four hypothetical sales volumes, rounded so that m takes simple values (m = N ÷ 292.2 million; e ≈ 2.718):
- 73 million tickets: m = 0.25. P(≥2) = 1 − 1.25 × 0.7788 ≈ 2.6%.
- 146 million tickets: m = 0.5. P(≥2) = 1 − 1.5 × 0.6065 ≈ 9.0%.
- 292 million tickets: m = 1. P(≥2) = 1 − 2 × 0.3679 ≈ 26.4%.
- 584 million tickets: m = 2. P(≥2) = 1 − 3 × 0.1353 ≈ 59.4%.
Doubling sales doesn't double the risk of sharing: it climbs faster at first, then slows as it approaches 100%. Even at m = 2, a draw has a 13.5% probability (e^(−2)) of having no winner at all.
The question that matters for a player
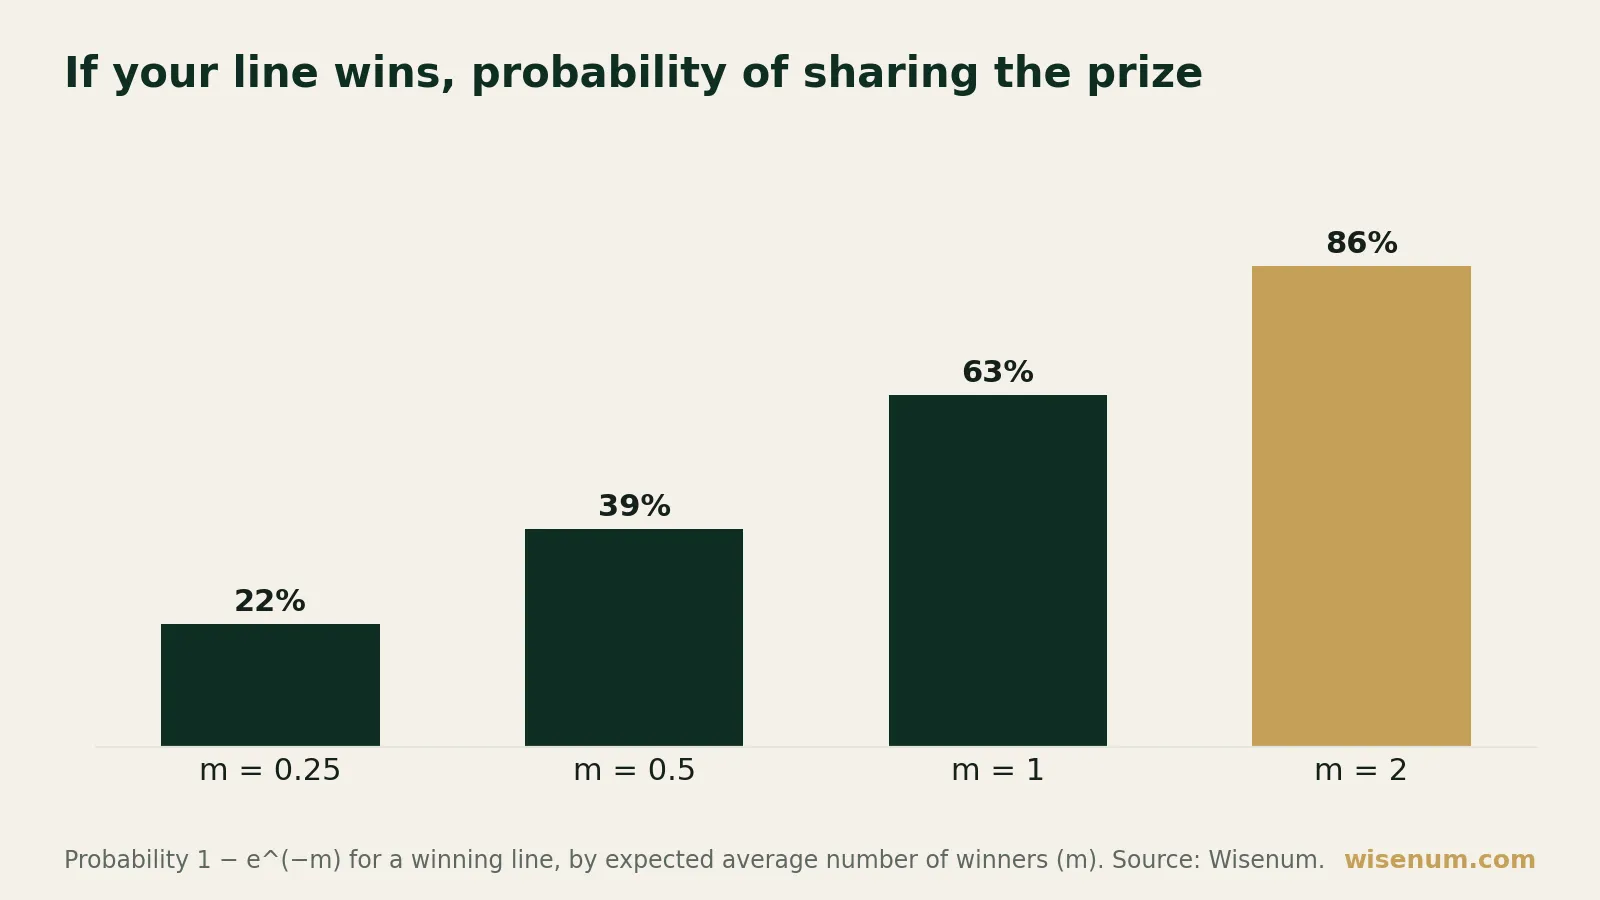
For a player, the practical question is: "if my line wins, what is the probability that another line wins too?" The other tickets follow the same distribution, so this probability is 1 − e^(−m):
- m = 0.25: about 22%;
- m = 0.5: about 39%;
- m = 1: about 63%;
- m = 2: about 86%.
That is what "sharing" means: the top prize is split among the winning lines. With heavy sales, each person's share shrinks, even if the advertised amount is high.
What the model doesn't say
The model assumes lines chosen at random. In reality, players don't choose at random: birthdays, for example, concentrate lines (distribution of number choices). For a very popular combination, the risk of sharing is higher than the formula gives; for a rarely played one, it is lower. That is precisely what Wisenum measures.
Three jackpots, three outcomes
Real cases illustrate the laws of probability without proving them: a model gives a risk, not a certainty.
- January 13, 2016, Powerball: $1.586 billion, three winners. Tickets sold in California, Florida and Tennessee. Each share came to about $528.8 million as an annuity, or $327.8 million as a cash payment (source). This jackpot came after the October 2015 rule change, which set the probability of winning at 1 in 292.2 million.
- October 23, 2018, Mega Millions: $1.537 billion, a single winner. One anonymous ticket, sold in Simpsonville, South Carolina (Mega Millions). A giant jackpot isn't always shared.
- September 6, 2025, Powerball: $1.787 billion, two winners. Two tickets, sold in Missouri and Texas, worth about $410.3 million each as a cash payment before tax (himillions.com).
Of these three cases, two jackpots were shared and only one went to a single winner. Three examples prove nothing statistically: they show that when sales climb, both outcomes remain possible. Because the sales detail for each draw isn't in our sources, we don't calculate their exact m.
The takeaway
A higher jackpot attracts more tickets, and the average number of expected winners (m = N × p) rises with sales. The probability of sharing, 1 − e^(−m) for a winning line, therefore climbs with jackpot size, without ever becoming certain.
This doesn't change the probability of winning, which is the same for every line (for example 1 in 139,838,160 for EuroMillions, detailed calculation here). The only thing that varies is the risk of having to share the prize if your line comes up: it depends on the number of players, and on how popular the combination you chose is.
See where your line sits among the most common picks: Analyze a line
Play for fun, and only spend what you can afford to lose. Responsible gambling support: in the US, call 1-800-GAMBLER (ncpgambling.org); in the UK, visit BeGambleAware.
Frequently asked questions
Does a bigger jackpot change the probability of winning?
No. The probability of winning is the same for every line, whatever the jackpot amount. A larger jackpot does attract more players, which only raises the risk of having to share the prize if your line comes up.
Why do giant jackpots get shared more often?
Because a bigger jackpot encourages more people to play. If N tickets are sold and p is the probability of winning, the average number of expected winners is m = N × p. As m rises, the probability of sharing (1 − e⁻ᵐ) climbs quickly.
What is the Poisson formula and how does it work?
The Poisson distribution counts rare, independent events. It says that if m is the average number of winners, the probability of at least two winners is 1 − (1 + m) × e⁻ᵐ. At m = 2 (584 million tickets), that probability reaches 59%.
Why is sharing never certain, even with a huge jackpot?
Because the Poisson model describes averages, not certainties. With m = 2, there is still a 13.5% probability that no other ticket wins. The Mega Millions jackpot of October 23, 2018 ($1.537 billion) had only one winner: a large jackpot isn't always shared.
Why can the real risk of sharing differ from the formula?
The formula assumes lines are chosen at random, which isn't the case. Birthdays and other popular numbers concentrate players' choices. A heavily played combination has a higher risk of being shared than a rare one: that is what Wisenum measures.
Every valid combination has the same probability of being drawn. Wisenum does not predict winning numbers.
Sources
- The demand for Euromillions lottery tickets: An international comparison
- Analysis of Profitability of Major World Lotteries (Kozník 2016)
- The sales effects of Powerball and Mega Millions game redesign (Combs & Spry 2018)
- Powerball & Powerplay Historical Sales Data (lottoreport.com, Multi-State Lottery Association)
- Powerball January 13, 2016 Jackpot Split: $1.586 billion (California, Florida, Tennessee)
- Mega Millions Record Jackpot Won in South Carolina — October 23, 2018 ($1.537 billion)
- Biggest Lottery Winners 2026 — All-Time Jackpot Records (himillions.com)